| Author |
 Topic Topic  |


|
|
looker22
Burkina Faso
Posts |
 Posted - 02/26/2008 : 02:04:22 AM Posted - 02/26/2008 : 02:04:22 AM


|
Origin Version (Select Help-->About Origin): 8.0
Operating System:Windows Vista
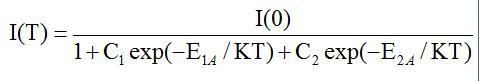
Help!I need to curve fit my data to the Arrhenius model.I am plotting my graph for Integrated PL Intensity vs 1/T.
Dependent variables:IT
Independent variables:T (Plotting 1/T thus set as T in function)
Parameters: I0,C1,Ea1,C2,Ea2
k = 1.38*10^-23 (Boltzmann constant)
Function:IT = I0 /( 1 + C1*exp(-Ea1*T/(1.38*10^(-23)))+ C2*exp(-Ea2*T/(1.38*10^(-23))))
Compiled done correctly.
X-axis values:
0.23256
0.1
0.05
0.03333
0.025
0.02
0.01667
0.01429
0.0125
0.01111
0.01
0.00833
0.00714
0.00625
0.00556
0.005
0.00455
0.00417
0.00385
0.00357
0.00333
Y-Axis Values:
31104.73877
29000.68793
21984.24408
12966.13362
7674.22404
4686.32585
3223.29419
2360.23168
1892.84186
1540.49311
1321.75368
1010.63186
789.76196
733.07144
667.57381
591.35511
515.70761
506.03149
404.55926
362.06002
350.56805
Instead of getting any nice exponential graph, i got a straight line? I tried various parameters but they didnt provide the proper curve fit. Can any smart soul pls help me out here? Ur help will be truly truly appreiciated! thx
|
|
|
jnikolaou
Greece
Posts |
Posted - 02/26/2008 : 12:15:24 PM
|
| Do you mean the line that is parallel with x axis? |
 |
|
|
larry_lan
China
Posts |
Posted - 02/27/2008 : 04:57:59 AM
|
Hi:
First of all, please avoid using parameter names like t, it may cause some compile error.
The main problem in your function is, this model is over parameterized. Actually, most of exponential model are over-parameterized. So there may be multiple solutions. In over-parameterized model, the fitted result strongly depends on the initial values.
For example, I can fit the curve using these initial values:
I0 = 35000;
C1 = 1;
Ea1 = 1E-25;
C2 = 1;
Ea2 = 1E-25;
I am not sure whether the fitted result have practical meanings, may be you can find some empirical value from some papers?
Thanks
Larry
OriginLab Technical Services |
|
|
|
looker22
Burkina Faso
Posts |
Posted - 02/27/2008 : 08:44:59 AM
|
larry_lan! Thx so much for ur help!!! You're superb
First of all, please avoid using parameter names like t, it may cause some compile error.
Note taken*
My FYP supervisor gave me these values in some paper:
C1=5.66, E1A=8.2meV
C2=5276, E2A=42.7meV
which was why i got a straight line...
And with ur parameters i managed to Curve fit it Very smoothly! Just curious, how did u manage to come up with those parameters?
Because earlier on i was the same dude that posted the thread on how to curve fit with Varshni's equation. the curve fit i got were not very smooth.
|
|
|
|
larry_lan
China
Posts |
Posted - 02/27/2008 : 09:34:52 AM
|
Take a simple model as example, when there is a asymptote:

The blue part in the follow function should close to zero. 

Thanks
Larry
OriginLab Technical Services |
|
|
|
looker22
Burkina Faso
Posts |
Posted - 02/27/2008 : 10:14:32 AM
|
Wow Thx again for your fast reply! Praying that i did the right thing cause tml i'm gonna face the wrath from my Sup... =/ thx!
Hope to seek help from you in future when i need it! cheers  |
|
|
|
suikou
Brazil
Posts |
Posted - 02/27/2008 : 9:52:23 PM
|
Ops, it should be a very hard task for most of people to guess the proper initial start values like larry_lan. Luckily, an optimization software package, 1stOpt (or Auto2Fit), let you forget the headache job of estimating initial start values. For looker22��s problem here, with random start values, 1stOpt will get a unique result every time:
Root of Mean Square Error (RMSE): 143.597802094357
Correlation Coef. (R): 0.999893430549993
R-Square: 0.999786872457034
Parameters Best Estimate
---------- -------------
i0 31085.2336283046
c1 89.9890500975424
ea1 2.01270454996536E-21
c2 1.94021450157707
ea2 4.61785752687395E-22
|
|
|
|
larry_lan
China
Posts |
Posted - 02/28/2008 : 04:23:54 AM
|
The reason 1stOpt generate unique results is that they use some strategy/routine to create the initial values. So for a certain model and data, I am not surprise that there is only one set of fitted values.
As I mentioned above, from the mathematical point of view, most of the exponential models are over-parametrized. So there should be infinite solutions. Regression analysis is far beyond finding the largest R^2 value, and the researcher should decide what kind of values are practical/physical meaningful. So empirical values should be considered first.
It's a good feature to auto initial the parameters. Automatically or manually, I think it's the two sides of the coin.
Thanks
Larry
OriginLab Technical Services
Edited by - larry_lan on 02/28/2008 04:27:19 AM |
|
|
|
suikou
Brazil
Posts |
Posted - 02/28/2008 : 09:34:54 AM
|
| Is there any planning for the next Origin version to add the function of "auto initial the parameters"? With the only "one sides of the coin", Origin is, in personal opinion, far behind of AutoFit in the field of nonlinear regression. |
|
|
|
looker22
Burkina Faso
Posts |
Posted - 03/06/2008 : 12:12:21 PM
|
Hi guys once again i need some help >.<
Btw suikou, any other software to recommend that is free other than 1stOpt and Auto2Fit. i think i need the initial parameters for the next few sets of data that i'm curve fitting..Btw i'm using windows vista OS.
Function is given in OriginPro8: Exponential >> ExpDecay1>>
y = y0 + A1*exp(-(x-x0)/t1)
My supervisor asked me to set these parameters however i cant seem to curve fit them nicely despite playing around with the values.
Y0=10
X0=260
A=10
t0=1
1 set of data==>
X-axis values:
0
2.363
4.726
7.089
9.452
11.815
14.178
16.541
18.904
21.267
23.63
25.993
28.356
30.719
33.082
35.445
37.808
40.171
42.535
44.898
47.261
49.624
51.987
54.35
56.713
59.076
61.439
63.802
66.165
68.528
70.891
73.254
75.617
77.98
80.343
82.706
85.069
87.432
89.795
92.158
94.521
96.884
99.247
101.61
103.973
106.336
108.699
111.062
113.425
115.788
118.151
120.514
122.877
125.241
127.604
129.967
132.33
134.693
137.056
139.419
141.782
144.145
146.508
148.871
151.234
153.597
155.96
158.323
160.686
163.049
165.412
167.775
170.138
172.501
174.864
177.227
179.59
181.953
184.316
186.679
189.042
191.405
193.768
196.131
198.494
200.857
203.22
205.584
207.947
210.31
212.673
215.036
217.399
219.762
222.125
224.488
226.851
229.214
231.577
233.94
236.303
238.666
241.029
243.392
245.755
248.118
250.481
252.844
255.207
257.57
259.933
262.296
264.659
267.022
269.385
271.748
274.111
276.474
278.837
281.2
283.563
285.926
288.29
290.653
293.016
295.379
297.742
300.105
302.468
304.831
307.194
309.557
311.92
314.283
316.646
319.009
321.372
323.735
326.098
328.461
330.824
333.187
335.55
337.913
340.276
342.639
345.002
347.365
349.728
352.091
354.454
356.817
359.18
361.543
363.906
366.269
368.633
370.996
373.359
375.722
378.085
380.448
382.811
385.174
387.537
389.9
392.263
394.626
396.989
399.352
401.715
404.078
406.441
408.804
411.167
413.53
415.893
418.256
420.619
422.982
425.345
427.708
430.071
432.434
434.797
437.16
439.523
441.886
444.249
446.612
448.975
451.338
453.702
456.065
458.428
460.791
463.154
465.517
467.88
470.243
472.606
474.969
477.332
479.695
482.058
484.421
486.784
489.147
491.51
493.873
496.236
498.599
501
503
506
508
510
513
515
518
520
522
525
527
529
532
534
536
539
541
543
546
548
551
553
555
558
560
562
565
567
569
572
574
577
579
581
584
586
588
591
593
595
598
600
603
605
607
610
612
614
617
619
621
624
626
629
631
633
636
638
640
643
645
647
650
652
655
657
659
662
664
666
669
671
673
676
678
681
683
685
688
690
692
695
697
699
702
704
707
709
711
714
716
718
721
723
725
728
730
733
735
737
740
742
744
747
749
751
754
756
759
761
763
766
768
770
773
775
777
780
782
785
787
789
792
794
796
799
801
803
806
808
811
813
815
818
820
822
825
827
829
832
834
837
839
841
844
846
848
851
853
855
858
860
863
865
867
870
872
874
877
879
881
884
886
888
891
893
896
898
900
903
905
907
910
912
914
917
919
922
924
926
929
931
933
936
938
940
943
945
948
950
952
955
957
959
962
964
966
969
971
974
976
978
981
983
985
988
990
992
995
997
1000
1002
1004
1007
1009
1011
1014
1016
1018
1021
1023
1026
1028
1030
1033
1035
1037
1040
1042
1044
1047
1049
1052
1054
1056
1059
1061
1063
1066
1068
1070
1073
1075
1078
1080
1082
1085
1087
1089
1092
1094
1096
1099
1101
1104
1106
1108
1111
1113
1115
1118
1120
1122
1125
1127
1130
1132
Y-Axis Values:
0
24
23
26
24
25
25
16
40
28
24
20
20
28
18
25
17
25
22
23
19
33
27
26
19
28
19
29
30
24
30
26
20
19
31
22
28
21
30
26
33
29
29
24
33
25
32
23
34
25
35
22
25
23
25
31
32
19
26
32
25
21
27
22
26
35
21
22
29
29
31
22
28
26
28
18
28
32
24
26
30
23
36
35
37
36
60
76
89
137
155
239
330
439
605
754
934
1040
1205
1302
1494
1498
1732
1764
1856
1750
1857
1627
1652
1478
1565
1409
1437
1301
1358
1266
1242
1148
1131
1150
1016
944
955
871
853
788
801
656
674
646
599
571
531
497
456
459
407
383
358
334
292
280
271
259
232
225
217
179
185
210
184
179
150
144
144
139
131
151
119
108
120
139
109
100
106
95
96
95
79
109
94
76
81
81
64
69
62
67
63
68
65
63
61
62
58
57
45
50
54
66
55
57
49
64
48
47
40
54
44
47
49
53
39
46
50
40
45
40
52
46
38
47
42
45
41
47
45
44
38
37
43
48
57
36
40
34
45
44
35
38
32
54
42
33
29
37
31
48
44
27
35
42
37
29
29
28
25
29
39
31
35
33
28
24
27
32
24
26
28
23
26
21
28
35
28
20
32
37
35
23
30
28
39
28
32
27
38
33
36
40
33
30
34
30
34
35
34
32
42
25
27
31
32
35
36
33
35
44
40
25
29
29
31
25
38
34
37
24
27
28
29
27
32
30
31
25
32
28
32
26
24
31
33
24
35
37
32
31
30
29
28
34
40
23
31
31
39
41
34
37
31
20
30
20
41
31
23
27
34
21
25
23
28
18
32
27
29
30
22
28
30
20
26
27
33
37
35
35
30
27
19
26
31
27
31
21
29
32
25
23
37
24
36
18
17
21
24
31
32
22
25
22
20
24
26
25
30
27
36
31
25
29
28
27
31
27
25
35
31
24
27
26
26
26
21
26
37
22
29
17
28
28
43
31
27
41
36
31
33
19
17
21
24
16
29
23
20
22
29
19
23
25
29
32
25
26
32
27
27
31
30
31
25
33
28
24
27
23
24
18
23
31
25
27
24
26
33
34
30
41
18
21
27
30
32
28
27
27
20
0
Edited by - looker22 on 03/06/2008 12:15:45 PM |
|
|
|
larry_lan
China
Posts |
Posted - 03/06/2008 : 10:19:21 PM
|
Hi:
If your dataset is large, please send the OPJ to tech@originlab.com.
NOTE that the exponential function is monotone, so it is impossible to fit such peak. I suggest you modify your model. If you want to use the initial values your supervisor suggested, may be you can change the function like:
y = y0 + A1*exp( -abs( (x-x0) )/t1 );
or you can use:
y = y0 + A1*exp( abs( (x-x0) )/t1 );
and then set t1 = -1
Thanks
Larry
OriginLab Technical Services |
|
|
|
looker22
Burkina Faso
Posts |
Posted - 03/07/2008 : 01:28:26 AM
|
ok thx again for the quick reply larry_lan !!!
Guess i'll have to ask him which one he wants >.<... U know profs.. they always like you to do things without telling you what they want ... |
|
|
| |
Topic |
|